Performance tests and monitoring
8.1 What a benchmark actually measures
PDF · 73Page 73For DDR5, evaluate bandwidth, latency, cache effects and performance in real workloads. Check stability using the method in Chapter 7.
A comparison is meaningful only within the same program and version, with identical CPU/Ring frequencies, Windows background load, cooling, and operating-system security-feature state.
FOUR DIFFERENT TYPES OF RESULTS
| Metric | What it shows | What affects it most |
|---|---|---|
| Read | Speed of reading data from memory | Frequency, IMC, Gear, channels, threads, and test implementation |
| Write | Speed of writing data to memory | CPU/IMC architecture, frequency, timings, and algorithm |
| Copy | Data copy: reading followed by writing | Entire memory path, cache, and working-set size |
| Latency | End-to-end access latency in nanoseconds | All timings, frequency, Gear, Ring/Uncore, and OS background activity |
THREE LEVELS OF RESULT VALIDATION

RULE FOR THIS CHAPTER
Change one profile, keep the environment identical, and do not cherry-pick the best run. Do not count a difference smaller than the natural run-to-run variation as an improvement.
8.2 AIDA64 EXTREME
PDF · 74Page 74
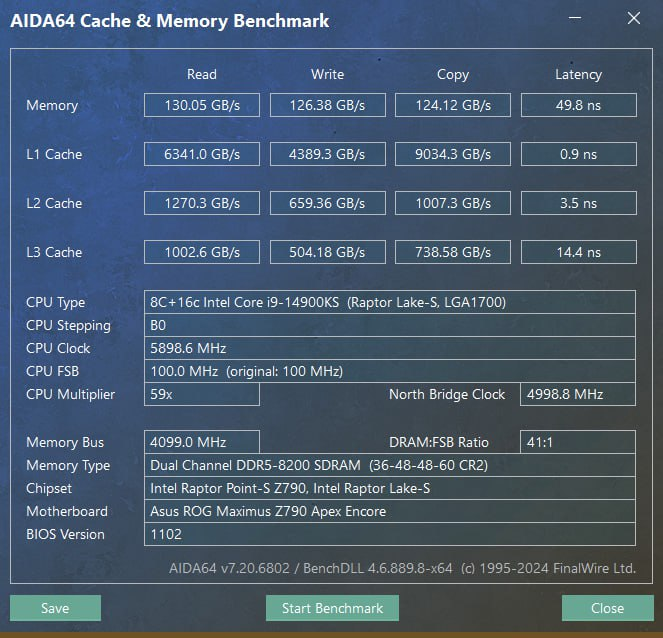
AIDA64 Cache & Memory Benchmark is a quick synthetic test for comparing profiles on the same system. According to the developer’s published description, Read/Write use a 64 MB block, while Copy transfers 32 MB and counts traffic in both directions. Latency uses random addresses within blocks.
HOW CACHE & MEMORY BENCHMARK WORKS
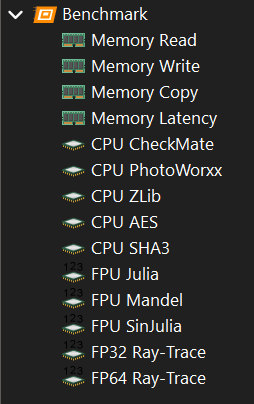
USEFUL TESTS FROM THE GENERAL BENCHMARK SECTION
Hardware Prefetcher on ASUS Z790 controls the MLC Streamer: it detects sequential accesses and fetches upcoming data into L2 ahead of demand. It is separate from Adjacent Cache Line Prefetch; the effect depends on the workload.
8.3 CPU-Z: settings and SPD
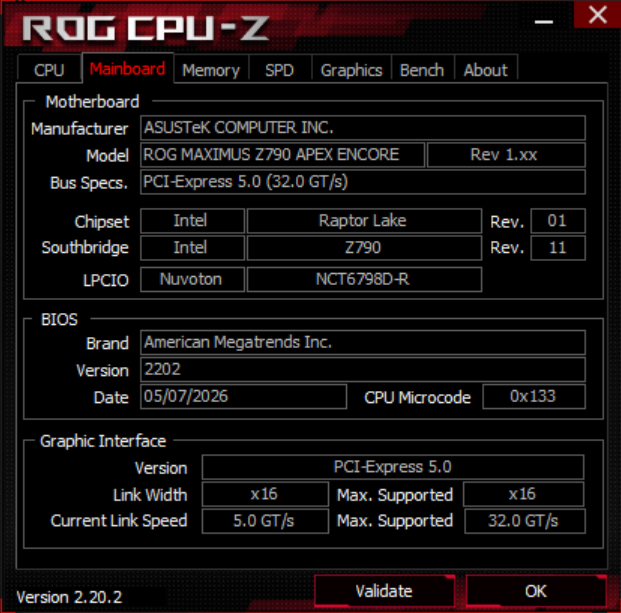
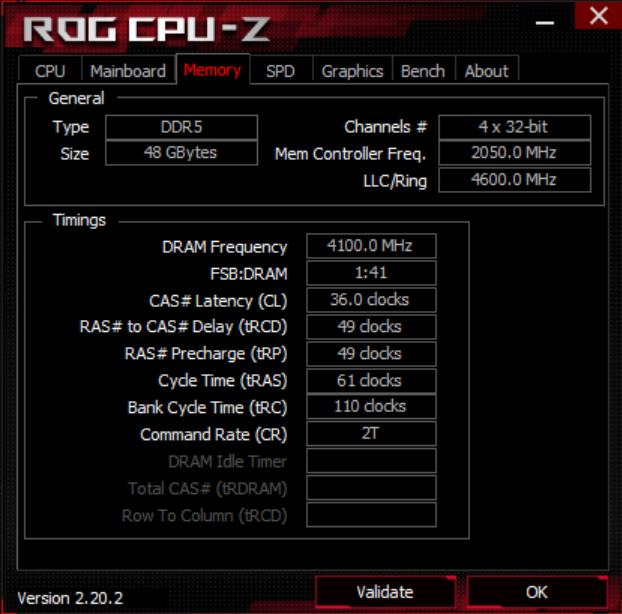
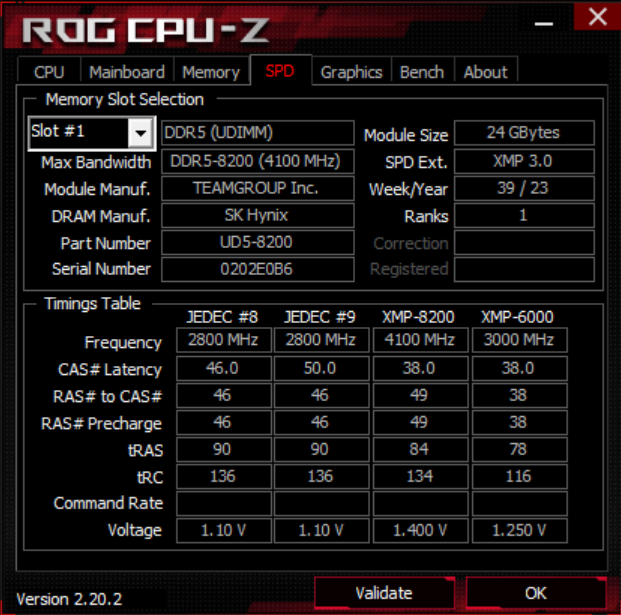
PDF · 75Page 75CPU-Z records the system configuration: CPU and motherboard models, BIOS version, actual memory clock, active primary timings and each module's SPD contents.
MY CPU-Z TABS: WHAT TO SAVE WITH THE RESULT
1. CPU 2. MAINBOARD 3. MEMORY 4. SPD / SLOT 1
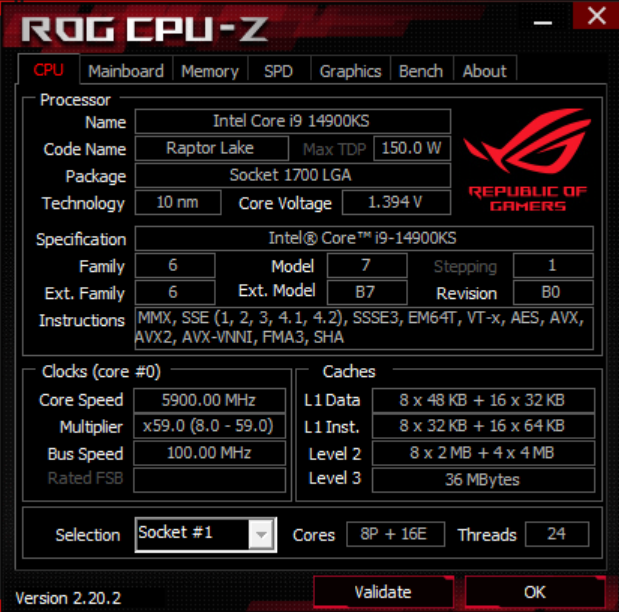
5. SPD / SLOT 2 6. BENCH 7. ABOUT
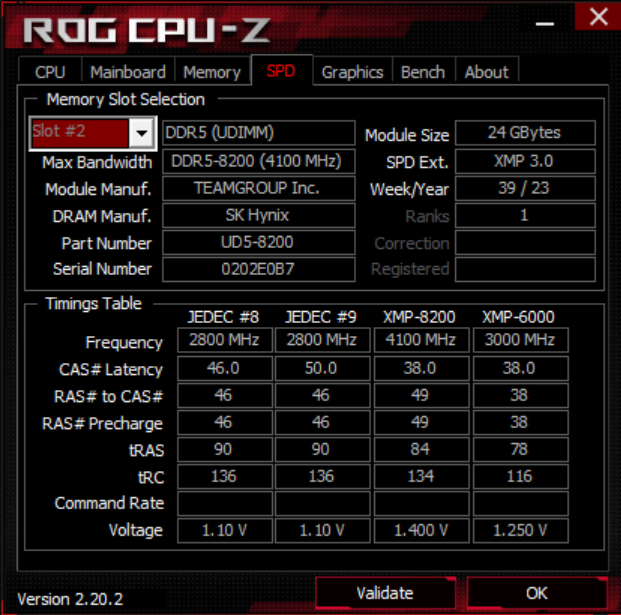
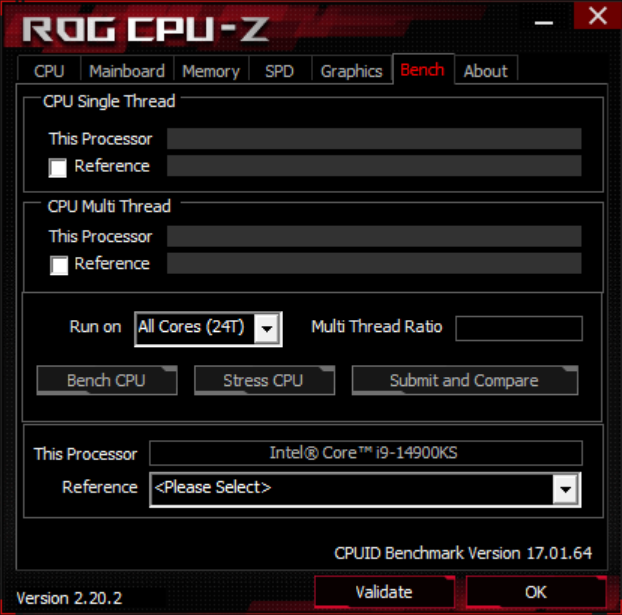
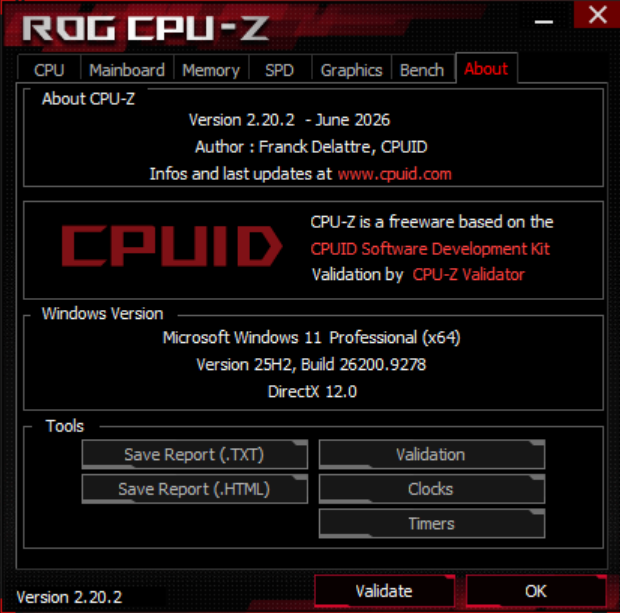
WHERE TO LOOK FIRST
| Tab | What to check | How to read it |
|---|---|---|
| CPU / Mainboard | Model, stepping, BCLK, motherboard, BIOS, and microcode | Records the platform and CPU state for repeatability |
| Memory | DRAM Frequency, 4 x 32-bit, tCL/tRCD/tRP/tRAS/tRC, and CR | 4100 MHz x 2 = DDR5-8200; these are the active parameters |
| SPD for every slot | Capacity, DRAM manufacturer, ranks, part/serial number, JEDEC, and XMP | SPD stores module profiles, but does not prove that XMP is currently active |
| Bench / About | Quick CPU score and exact CPU-Z version | Bench does not test memory; save the version with the screenshot |
8.4 HWiNFO: monitoring
PDF · 76Page 76
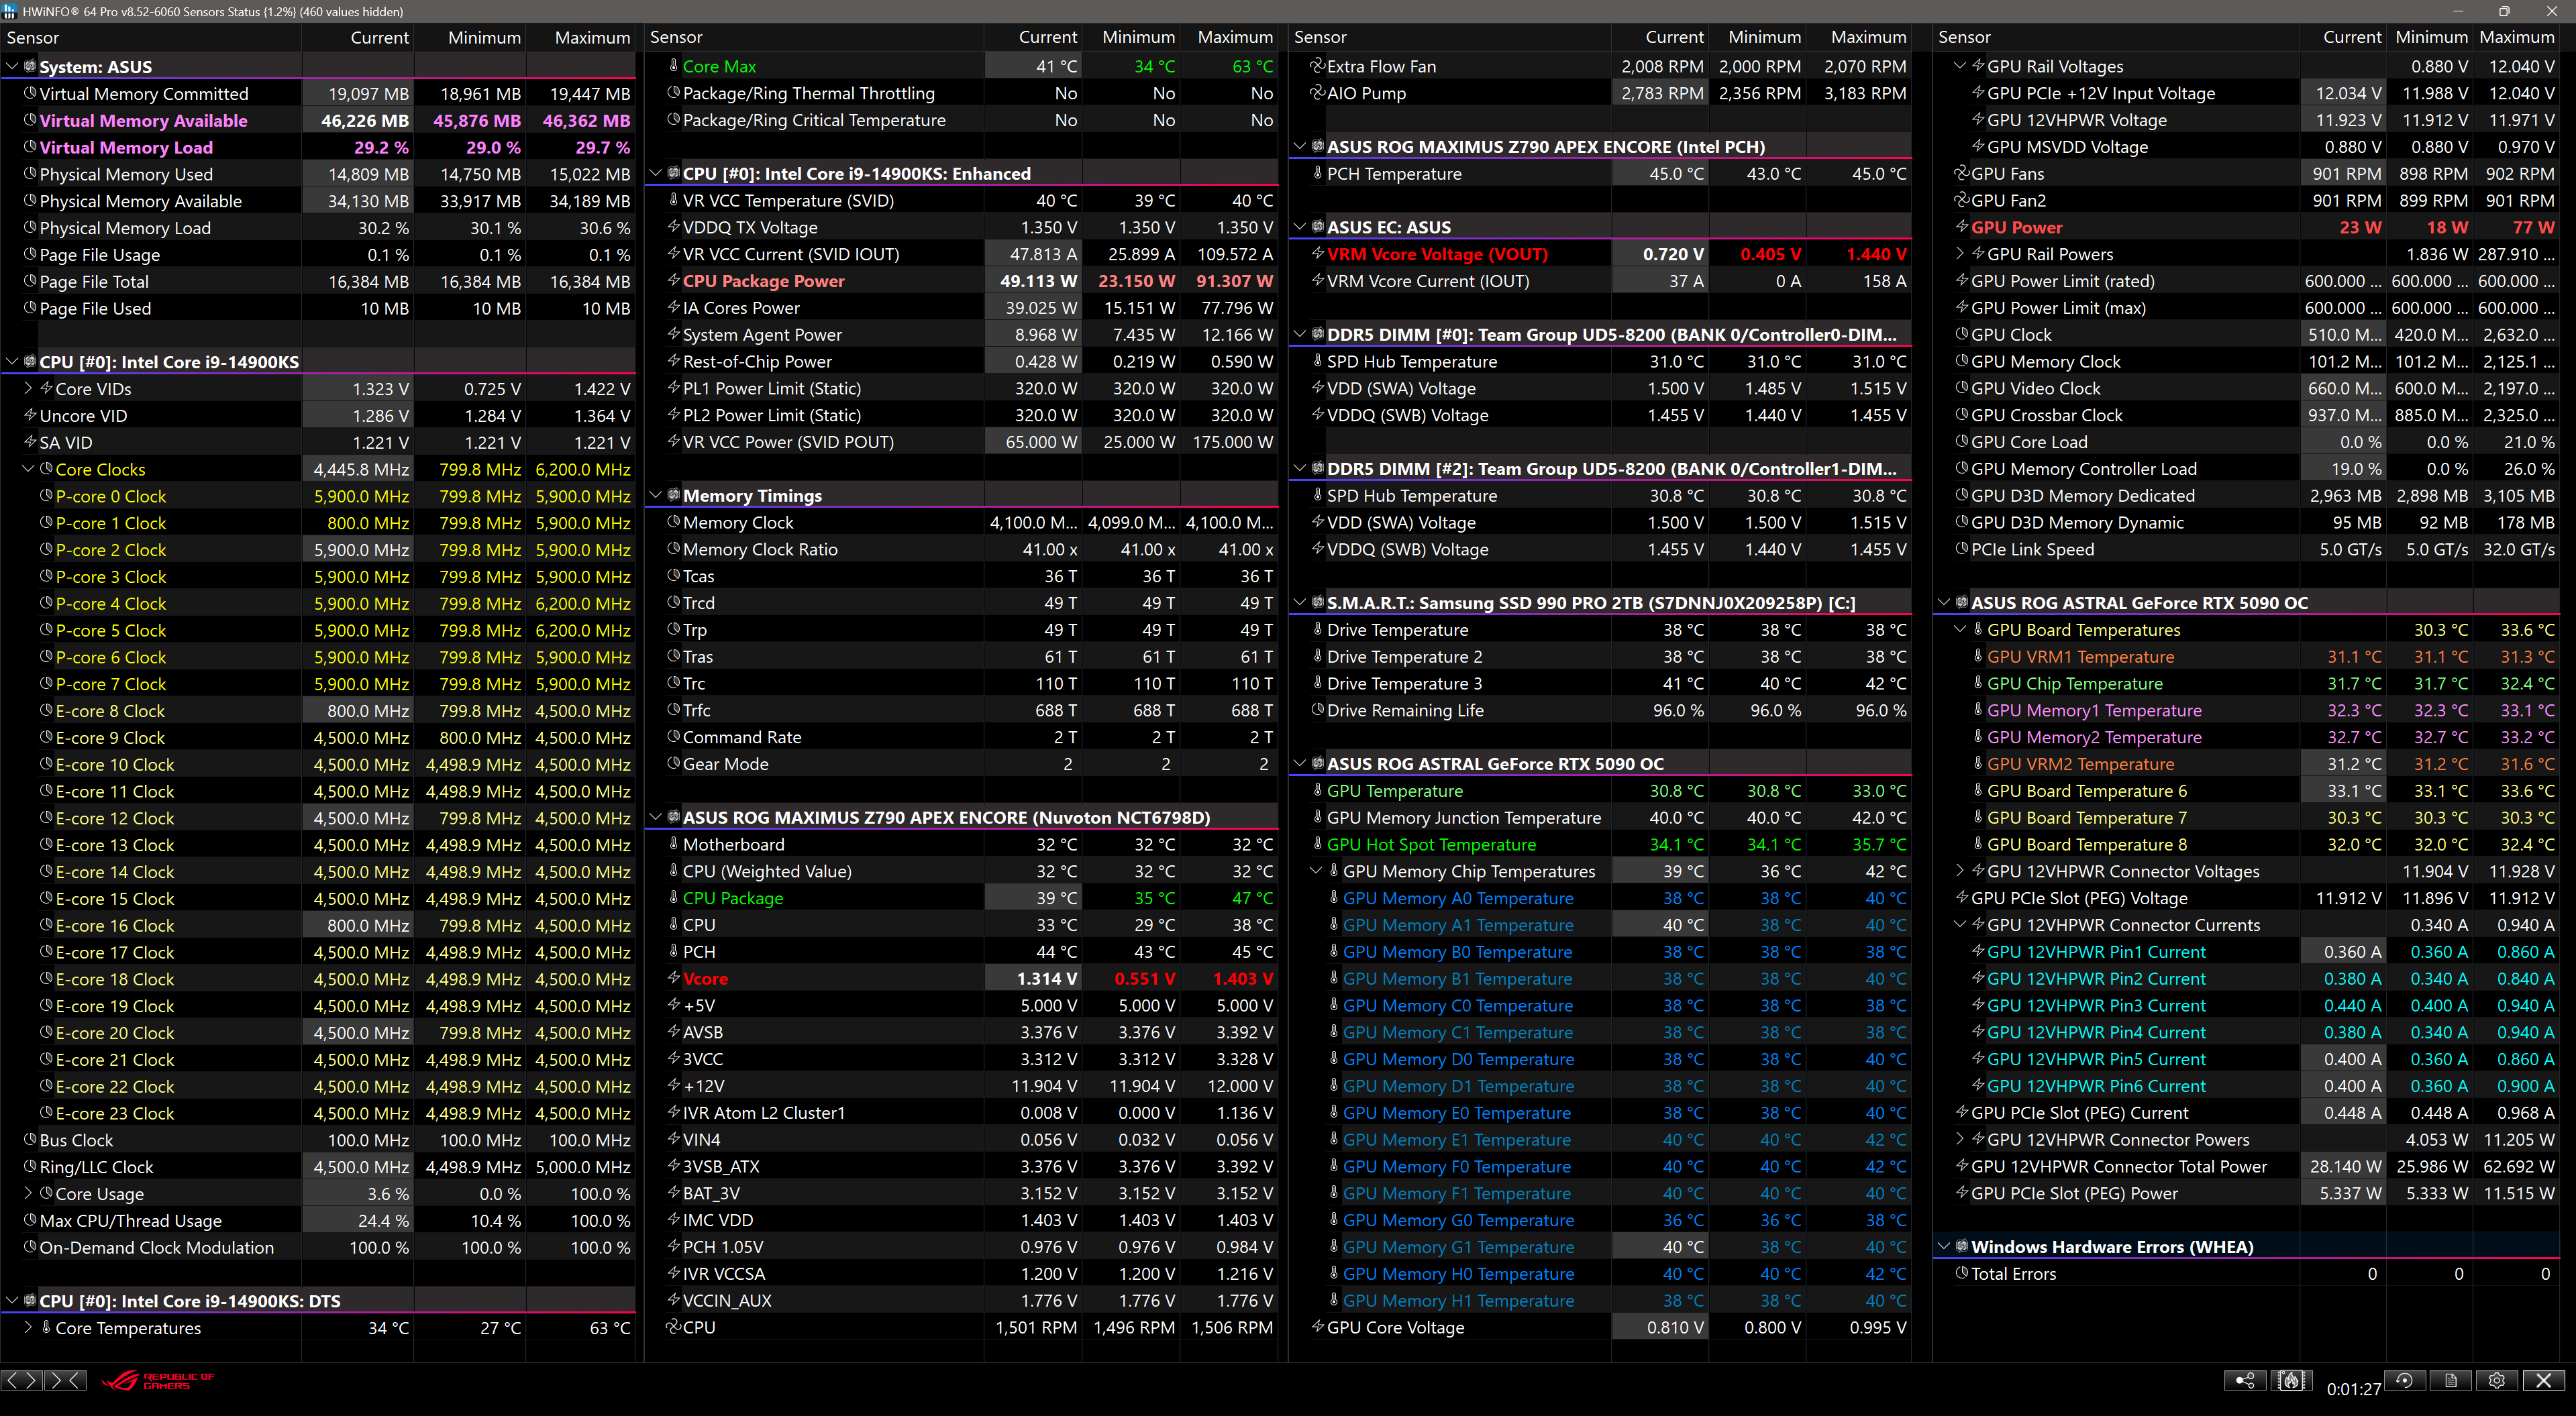
HWiNFO is my primary and, in my view, the best monitoring tool. It simultaneously shows module temperatures, actual* voltages, CPU/Ring frequencies, throttling, and WHEA counters.
* The readings are estimates: PMIC telemetry may be inaccurate. Actual voltage and ripple are checked with an oscilloscope.
MINIMUM SENSOR SET
| Reading | What to save | Important nuance |
|---|---|---|
| SPD Hub Temperature | Current, Maximum, and Average for each DIMM separately | This is the SPD Hub temperature, not the temperature of the DRAM dies themselves |
| VDD / VDDQ | Readings from both modules | When supported; recheck anomalies with PMIC and software limitations in mind |
| Memory Timings | Memory Clock, Gear, and active timings | Quick check that the system loaded the intended profile |
| CPU / Ring | Frequencies, power limits, and indications of throttling | A different CPU mode changes benchmark results |
| WHEA | Counter before and after the run | An increase requires diagnosis, but does not automatically implicate RAM |
MY WORKING SENSORS SCREEN
8.4.1 HWiNFO: the Memory Timings window
PDF · 77Page 77In addition to the basic Memory Timings section in Sensors, HWiNFO can open a separate ‘Memory Timings’ window with an expanded set of active memory parameters. This is convenient for checking the values actually applied after memory training, including AUTO settings calculated by the platform.
In Sensors-only mode, the window is available from the context menu of the HWiNFO notification-area icon.
WHAT THE SEPARATE WINDOW ADDS
Additional secondary, tertiary, and turnaround timings: tFAW, tRRD_S/L, tWTR_S/L, tRDPRE, tRDPDEN, tWRPRE, tWRPDEN, tRDRD/tRDWR/tWRRD/tWRWR sg/dg, and others; plus some internal parameters, including RTL. The available fields depend on the platform and HWiNFO version.
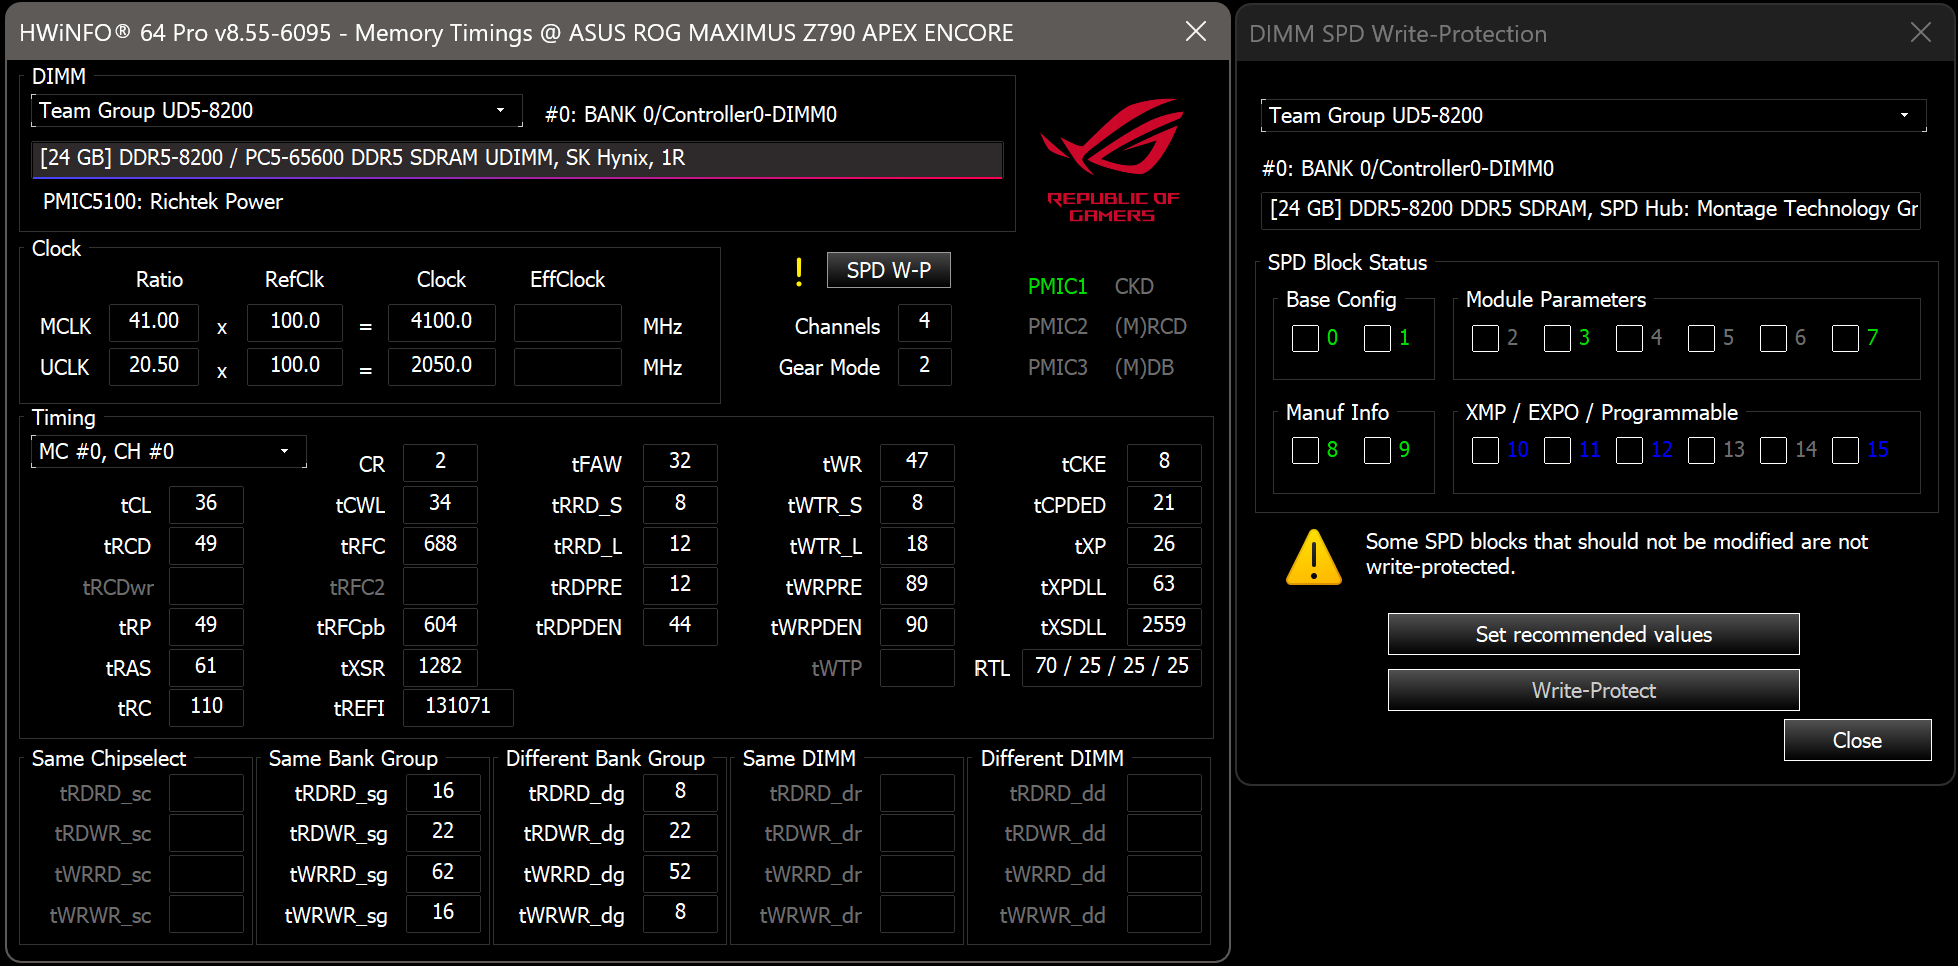
HWiNFO: advanced memory timings and SPD write-protection status
8.5 ASROCK TIMING CONFIGURATOR
PDF · 78Page 78ASRock Timing Configurator 4.1.7 is a convenient utility for viewing active primary, secondary, and tertiary timings directly in Windows. It provides a compact record of settings, including on compatible ASUS motherboards.
MY DDR5-8200 PROFILE ON Z790 APEX ENCORE
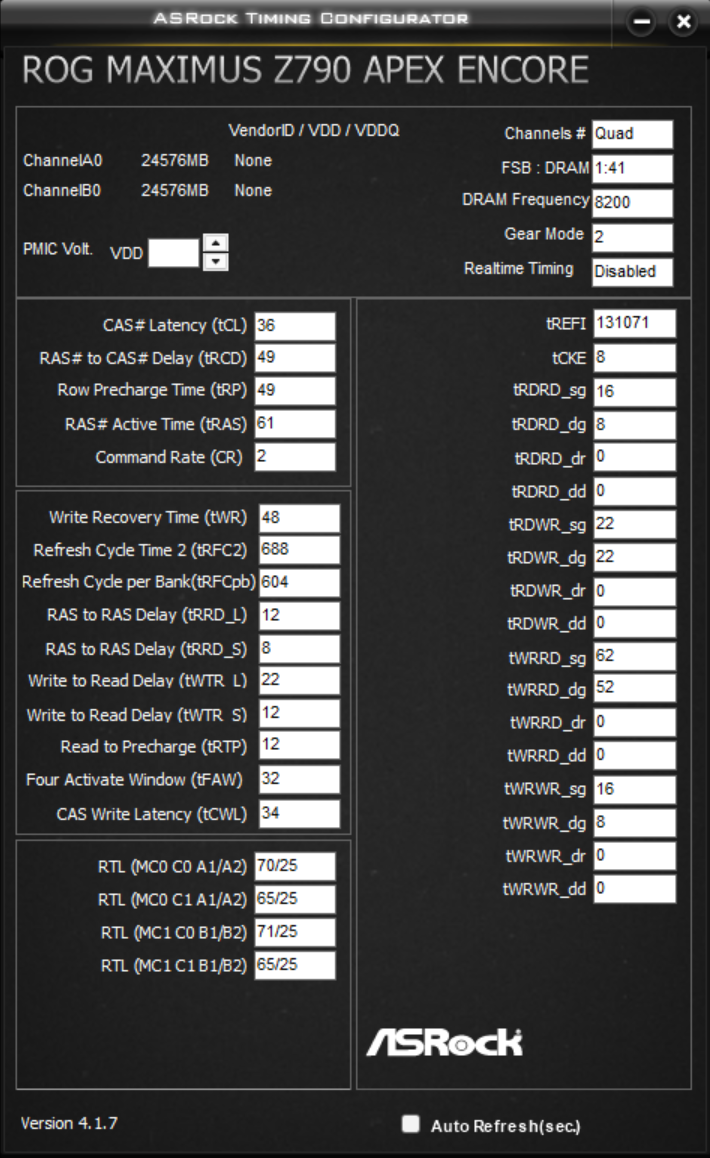
WTR calculations depend on the utility version; DDR4/DDR5 formulas and corrections are compared in 3.7.
8.6 pyhwinfo: low-level memory and IMC settings
PDF · 79Page 79pyhwinfo 0.8 dev is a low-level diagnostic utility for DDR5 overclocking. It reads applied memory and IMC parameters that ordinary monitoring shows only partially or not at all.
WHAT IT LETS YOU CHECK
MCLK / UCLK / BCLK (interface fields), memory data rate, and Gear Mode; primary / secondary / tertiary timings by channel and MC0/MC1; RTL; ODT (Wr, Park, ParkDqs, NomRd, NomWr, and others); Vref; SA VID, VDDQ TX, AC_LL / DC_LL; DIMM, SPD / PMIC, and available module voltages and temperatures.
After Memory Training, it lets you compare BIOS settings with the values actually applied. Checking AUTO, tertiary/turnaround timings, RTL, ODT, and Vref is especially useful because the platform calculates them during training.
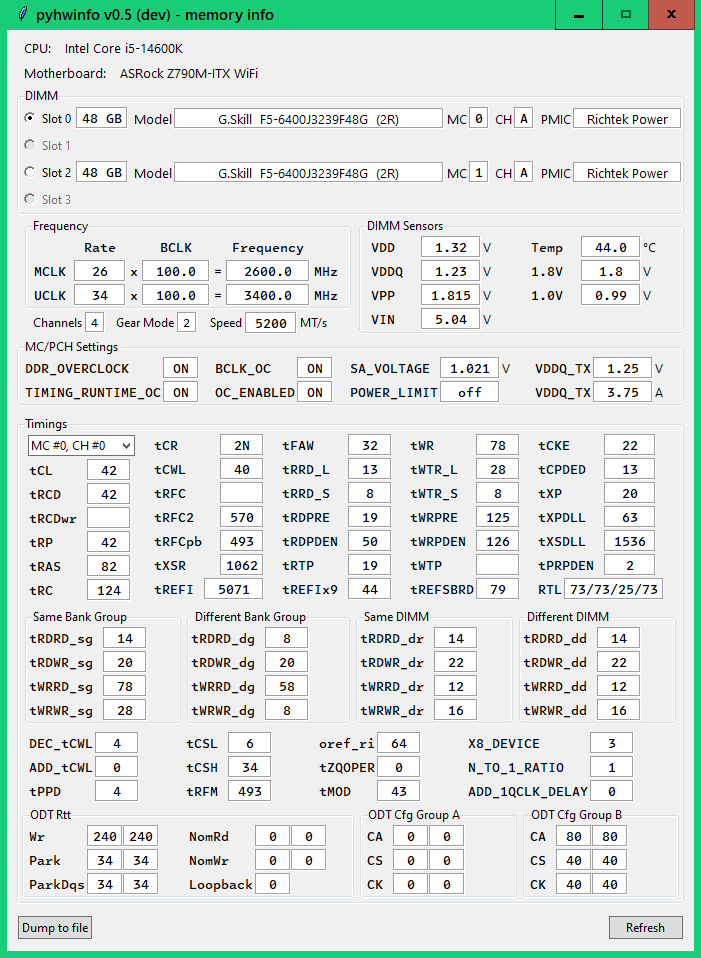
pyhwinfo: low-level DDR5 and memory-controller parameters
Screenshot shows v0.5 (dev): MC/PCH Settings section; separate Vref and AC_LL/DC_LL values are not shown here.
8.7 ASUS MEMTWEAKIT
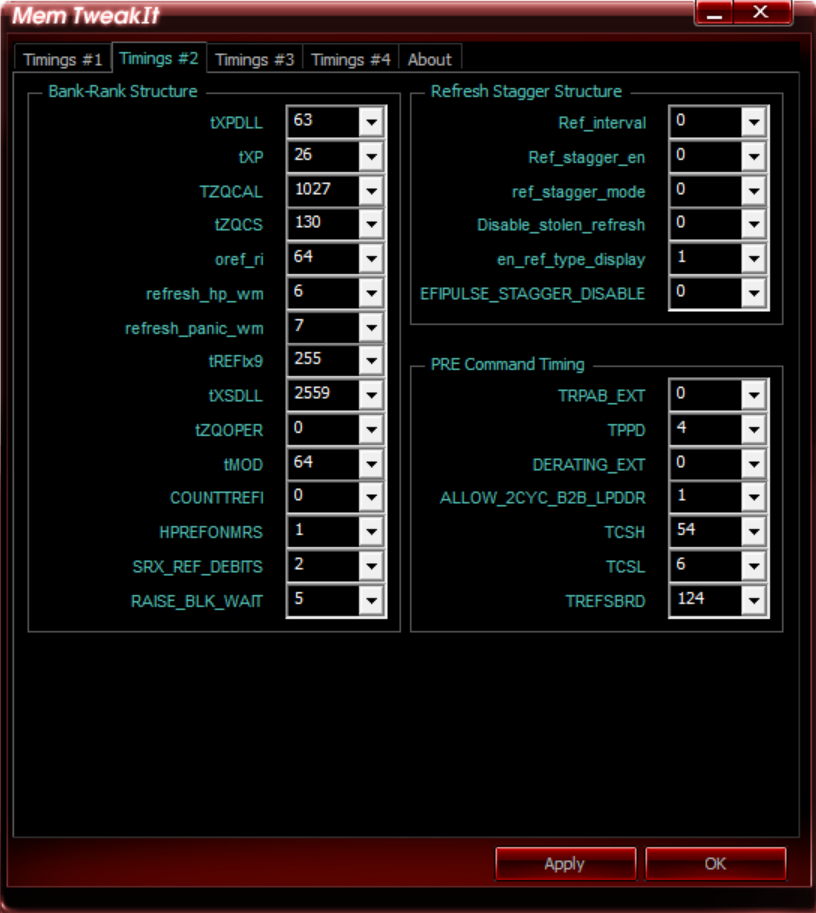
PDF · 80Page 80ASUS MemTweakIt shows more internal parameters than the compact ATC. On my Z790 Apex Encore, four tabs collect the primary, secondary, and tertiary timings, refresh behavior, scheduler, and RTL. In this manual, I use it to capture a detailed record of settings.
FOUR PAGES OF ONE DDR5-8200 CONFIGURATION
TIMINGS #1 / PRIMARY TIMINGS #2 / REFRESH
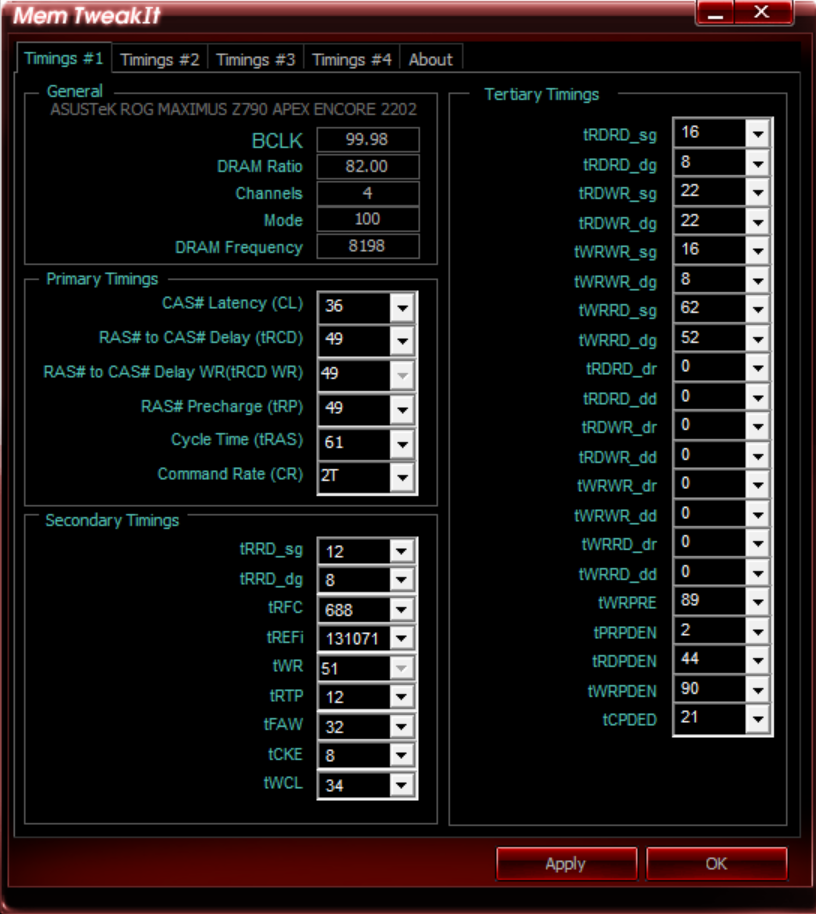
TIMINGS #3 / SCHEDULER TIMINGS #4 / RTL
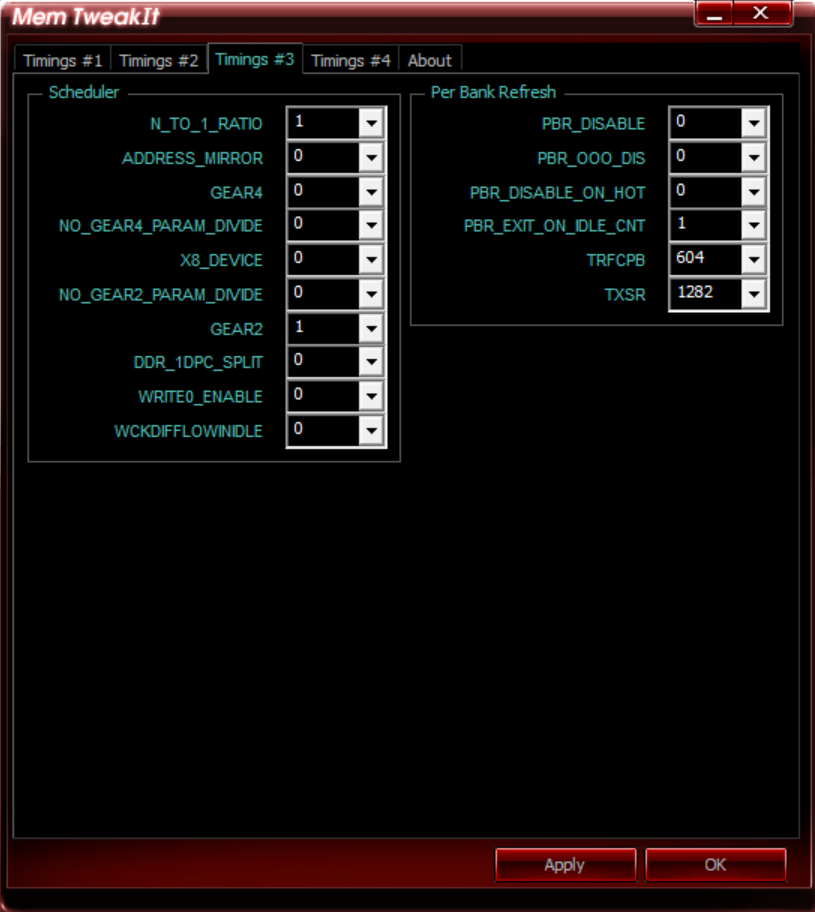
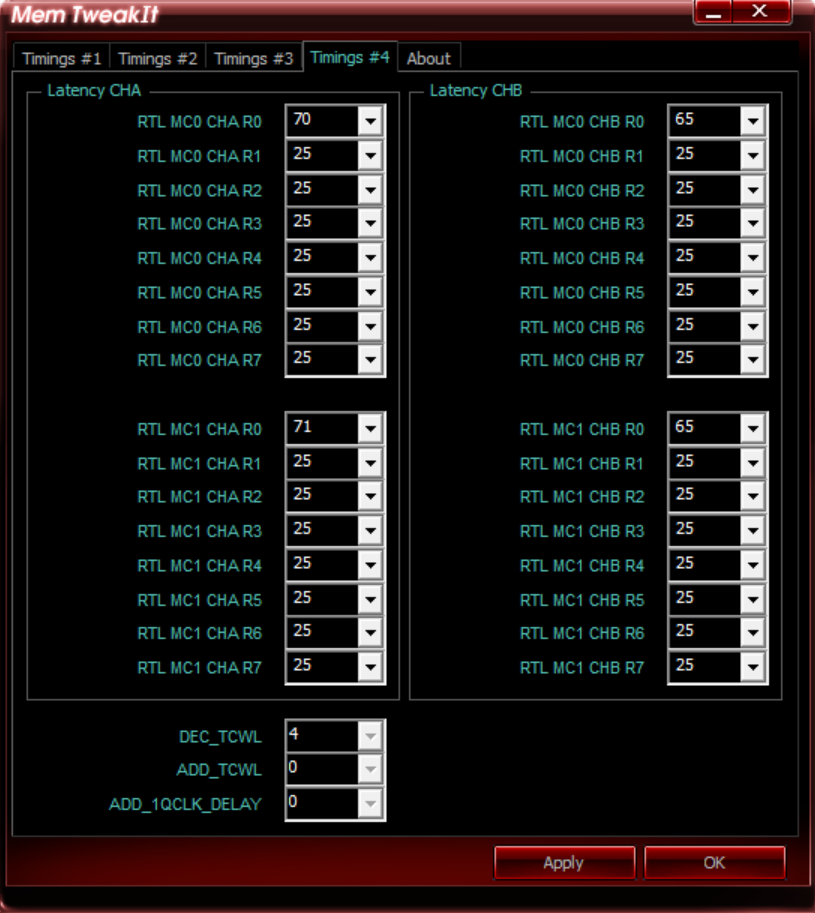
WR calculations depend on the MemTweakIt version; the old and DDR5 formulas are compared in 3.7.
8.8 Current alternative benchmarks
PDF · 81Page 81AIDA64 is usefully supplemented with one independent synthetic test and one real-world test. Results from different programs cannot be converted into one another: each uses its own working set and algorithm.
| Tool | What it measures | When useful | Limitation |
|---|---|---|---|
| Intel MLC 3.13 | Bandwidth and latency under increasing load | In-depth IMC and memory analysis | CLI; record launch parameters |
| OCCT 17.1.8 | Latency & Bandwidth L1/L2/L3/RAM | Modern graphical alternative to AIDA64 | Compare OCCT only with OCCT |
| 7-Zip 26.04 | Compression/Decompression LZMA | Real-world response of CPU, cache, and RAM | Same dictionary and thread count |
| Cinebench 2026 | Redshift scene rendering on the CPU | CPU score; tight timings sometimes add a few points | Not a memory test; gains may be within run variance |
| CapFrameX / PresentMon | Frame time, average FPS, and low percentiles | Benefit in a CPU-limited game | A GPU limit hides the effect |
| RTP Benchmark | Read/Write/Copy and random-access latency | An additional data point within RAM Test Pro | Methodology still developing |
8.9 STANDARDIZED PROTOCOL: MAKING THE NUMBERS REPRODUCIBLE
PDF · 81Page 81| Step | Action | What to record |
|---|---|---|
| 1 | Prepare an identical environment | BIOS, Windows, program versions, power, background activity, and cooling |
| 2 | Record the configuration | CPU-Z Memory/SPD and an ASRock Timing Configurator screenshot |
| 3 | Open HWiNFO Sensors | SPD Hub, VDD/VDDQ, WHEA, CPU/Ring, and throttling |
| 4 | Run five passes | Same test order, pauses, working set, and warm-up |
| 5 | Calculate the median and spread | Do not use the best run; do not count a small difference as a gain |
| 6 | Confirm with a workload | 7-Zip, Cinebench, or a game; Chapter 07 searches for errors separately |